Just-in-Time Inspect Guide
Just-in-time inspection captures module hierarchy and input/output signatures during real model execution, without tuning or compilation. Use it to understand what JIT tuning would see before you commit to a tuning strategy.
Overview
Just-in-time inspection provides:
- Module Discovery: Capture modules that execute at runtime
- Hierarchy View: See parent/child relationships and depth
- Input/Output Signatures: Record tensor shapes, dtypes, and argument structure
- HTML Report: Generate a shareable inspection report
Quick Start
Enable inspection
Add a single import at the top of your script to enable inspection mode:
Run a real workload and save a report
The example below mirrors the Stable Diffusion inspection workflow used in
tests/functional/pytorch/jit/006_jit_sd15_inspect.py:
import os
from logging import INFO, basicConfig
from pathlib import Path

import torch
from diffusers import StableDiffusionPipeline

import aitune.torch.jit.enable_inspection as inspection  # noqa: F401


def create_model():
    pipe = StableDiffusionPipeline.from_pretrained(
        "stable-diffusion-v1-5/stable-diffusion-v1-5", torch_dtype=torch.float16
    )
    pipe.to("cuda")
    return pipe


def main():
    basicConfig(level=INFO)
    prompt = (
        "A fluffy, orange tabby cat with bright green eyes is captured mid-air, "
        "pouncing playfully on a vibrant red ball of yarn"
    )
    pipe = create_model()

    def batch():
        with torch.no_grad():
            pipe([prompt] * 1, num_inference_steps=1)
            pipe([prompt] * 2, num_inference_steps=1)

    for _ in range(5):
        batch()

    html_path = "inspect_sd15.html"
    inspection.save_report(html_path, "SD15")


if __name__ == "__main__":
    main()
Open the report
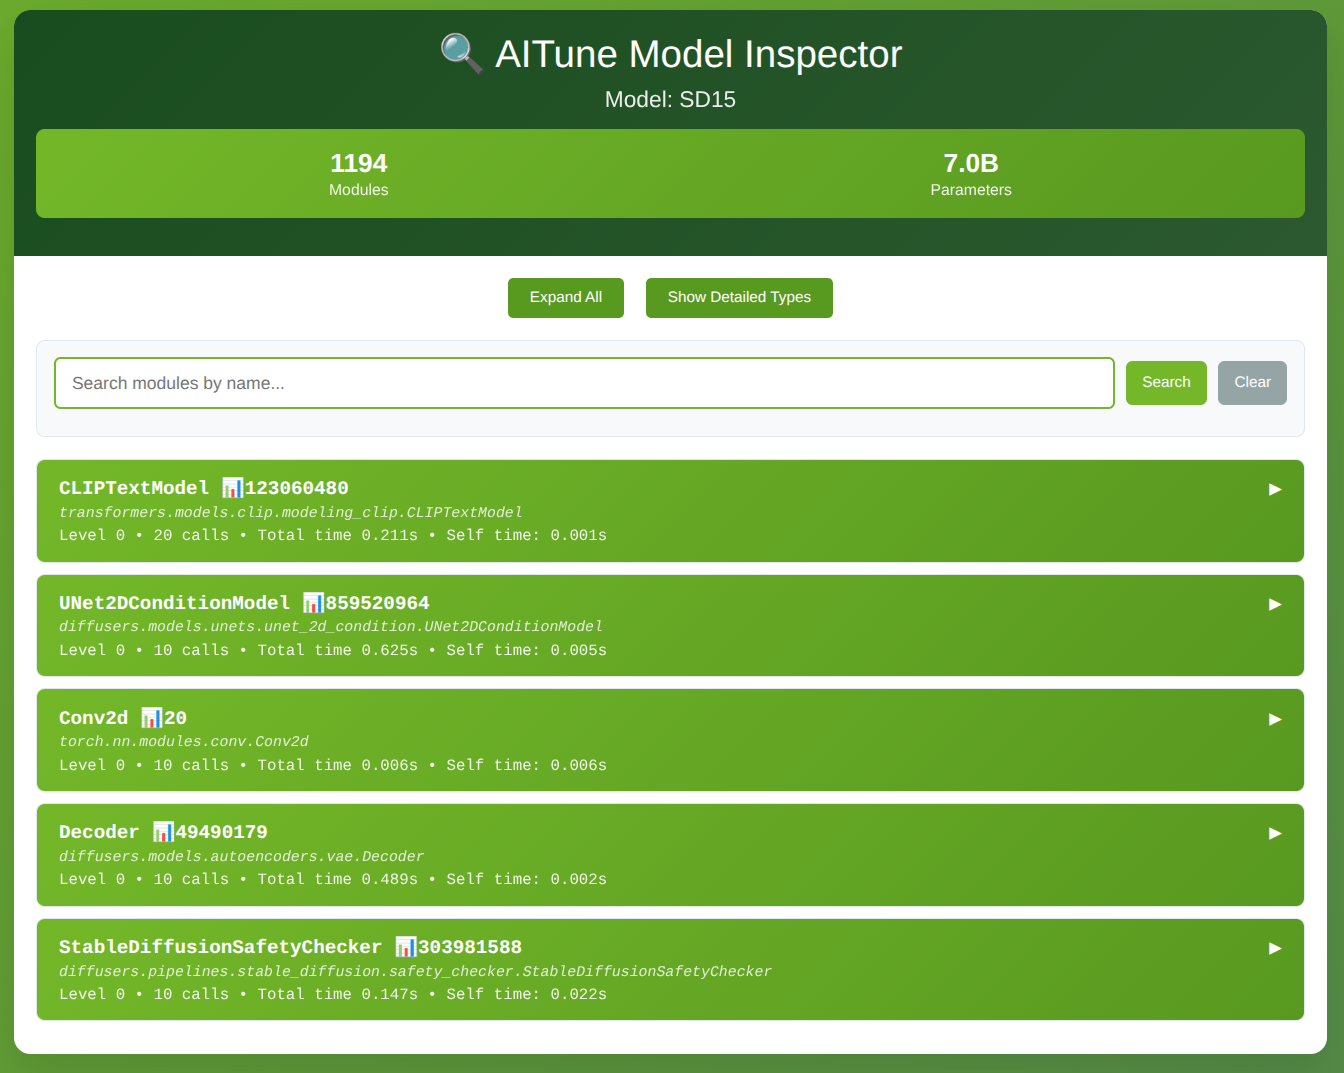
What the report shows
- Module summary: Total modules and basic statistics
- Module hierarchy: Tree view of the executed module structure
- Module details: Name, type, depth, parameter counts, call counts, execution times
- Inputs/outputs: Shapes, dtypes, and detected batch axes for each executed module
Example screenshots
The main view gives a top-level summary of discovered modules and quick navigation across the report sections.
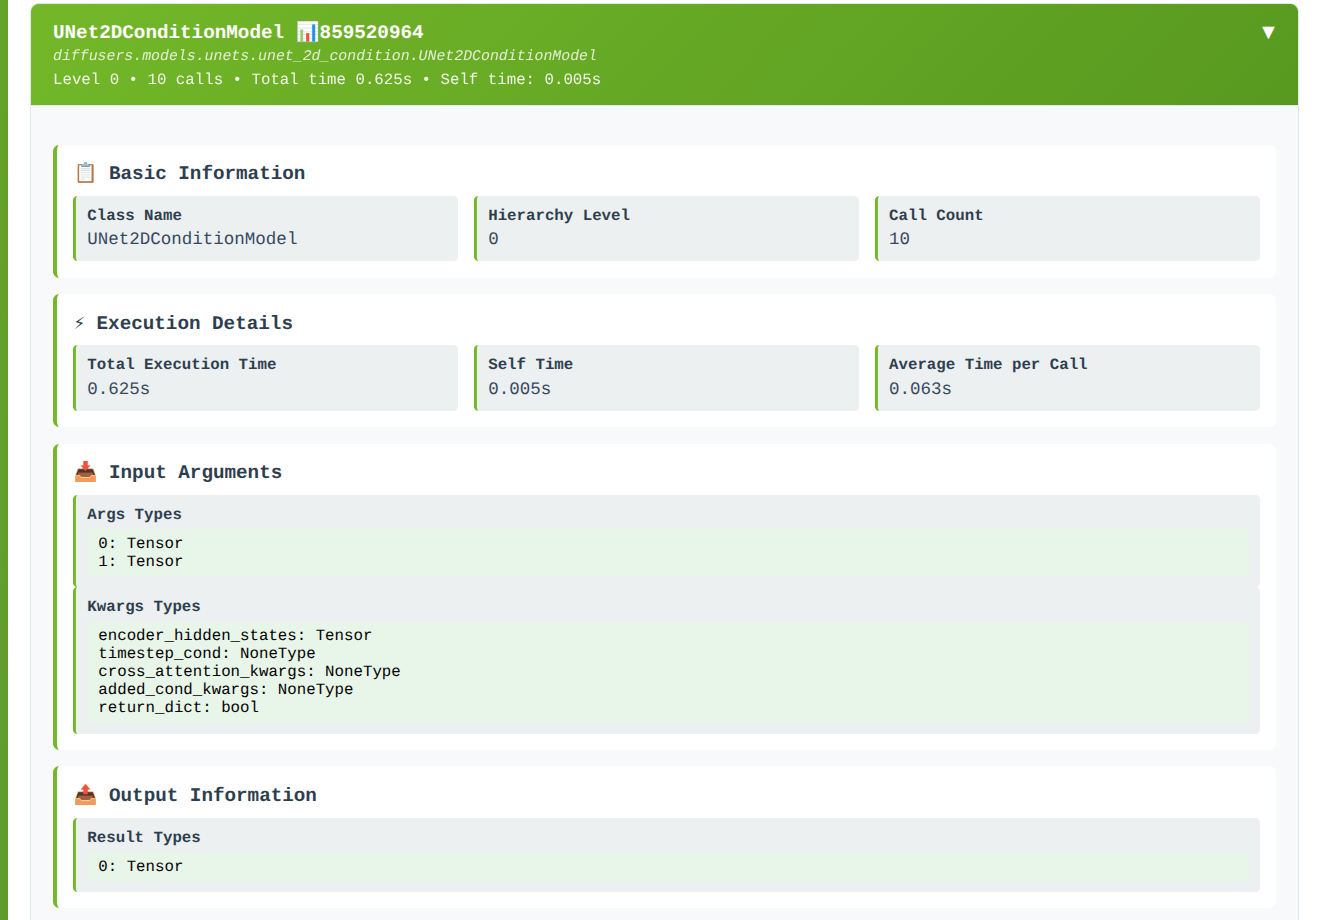
If you click on a particular module, the detailed view shows execution stats and its recorded input/output signatures.
Notes
- Inspection data is collected only for modules that actually execute.
- Running multiple batches with different shapes helps capture dynamic behavior.
- The report is generated from in-memory inspection data at
save_reporttime.
Next Steps
- Learn about Just-in-Time Tuning to actually tune models
- Compare with AOT Inspect for more control